
Floristic Quality Assessment in New Jersey

Let's say you walked up to me with two plant specimens and dumped them on my desk with a challenge. "OK, Mr. Botanist, tell me about the places where these plants came from". One specimen is pokeweed, the other a showy orchis.
The showy orchis (Galearis spectabilis) is easier. It probably came from a rich moist mature forest with diabase, limestone, or other calcareous rock type influencing the soil chemistry. In my area, it is frequently associated with species like tuliptree, spicebush, and black cohosh.
The pokeweed would be tough. It could be from the edge of a vegetable garden or a roadside -- or a tip-up mound in an old growth forest. This species responds to soil disturbance and light availability pretty much wherever it happens, and does well in a rich soil.
The character of these two plant species underlies a method of describing plant species "quality" called Floristic Quality Assessment (FQA). Floristic Quality Assessment is a method for describing the quality and diversity of wild and restored plant communities. It translates plant inventories into metrics that can be used to compare between sites or across time.
FQA is based on two fundamental tenets:
1. Some plant species exhibit fidelity to particular native habitats whereas others do not
2. Plant species have differing tolerance for human disturbance
Plant species with a high fidelity to intact native habitats are called "conservative" species. Plants on the opposite end of the spectrum are those we might term weedy or ruderal. Habitats with high numbers of conservative species are defined as high quality.
Each plant species in a state's flora is assigned a number from 0-10 reflecting its quality. These numbers are known as Coefficients of Conservatism (no, it's not a party of right-wing mathematicians). The abbreviation is the "C value".
Pokeweed properly deserves a C value of 1 (zeroes are for non-native species), and showy orchis' C value should be somewhere closer to a 10. Not only does the orchid require a relatively undisturbed habitat with specific geology and moisture, it (like other terrestrial orchids) can only recruit at a site if certain soil fungi are present. Its needs are specific but it can be a very long-lived and resilient species in the proper niche. By way of contrast, the pokeweed might come on strong in the same habitat (given some disturbance) but there's no way it could persist as long, be as tolerant of shade and other stressors, or build as enduring an architecture as the orchid.
All plant species will be somewhere on the spectrum between 0 and 10, some more generalist, others more conservative.
Spicebush seems to me to be a perfect 5 (though it is not necessarily exactly a 5 on all state lists). It exhibits fidelity to a real native habitat: rich moist forest (maybe even the same habitat as the orchid). So its C value should be somewhere in the range of 5 - 10. However, it is easily dispersed (primarily by birds), can recruit readily into post-agricultural woodlands, is very tolerant of logging and other canopy disturbances, and is generally a colonial, tough customer. Given its fidelity for rich forest (including some of the highest quality habitats in my area) it can hardly be termed a weed. But given its easy dispersal and recruitment and high tolerance for disturbance, it isn't a very conservative species either. It sits comfortably in the middle position.

Spicebush (Lindera benzoin)
This all translates into metrics reflecting a site's quality in the following way. An inventory containing a list of plants found on the site (or in the plots, transects, etc.) is uploaded to a database. I presently use the online database at UniversalFQA.org (see more below under "FQA in New Jersey"). Here, each plant on your inventory is matched with the C value from the pertinent state or regional flora. C values have been assigned by groups of local botanists for most of the United States.
Once the entire inventory has a C value assigned, this can be printed or viewed in a variety of ways. Further, a number of metrics are automatically generated by various manipulations of the C values. Here are some of the metrics available from UniversalFQA.org:
Table 1. FQA Metrics

By manipulating the values of all the plants on an inventory, metrics can be derived that suggest the character, diversity, and naturalness of a restoration site or a wild area.
I tend to use the Native Mean C as a simple metric to get a handle on the quality of a site. It's a simple average of the C values of all the native plants in the inventory. Even if the site is beat up, invaded and deer browsed, a high Native Mean C suggests to me that a site was once nice, contains relict specialist species, and may have high restoration potential.
For more precise work, I often consider the Total FQI. This works best when comparing survey units of fixed size, such as plots or quadrats. Because one factor in the calculation of this metric is the species richness, it's a pretty useless metric to compare between sites of dramatically unequal sizes. A two hundred acre but middling site may still have much higher species richness than a really nice five-acre fragment.
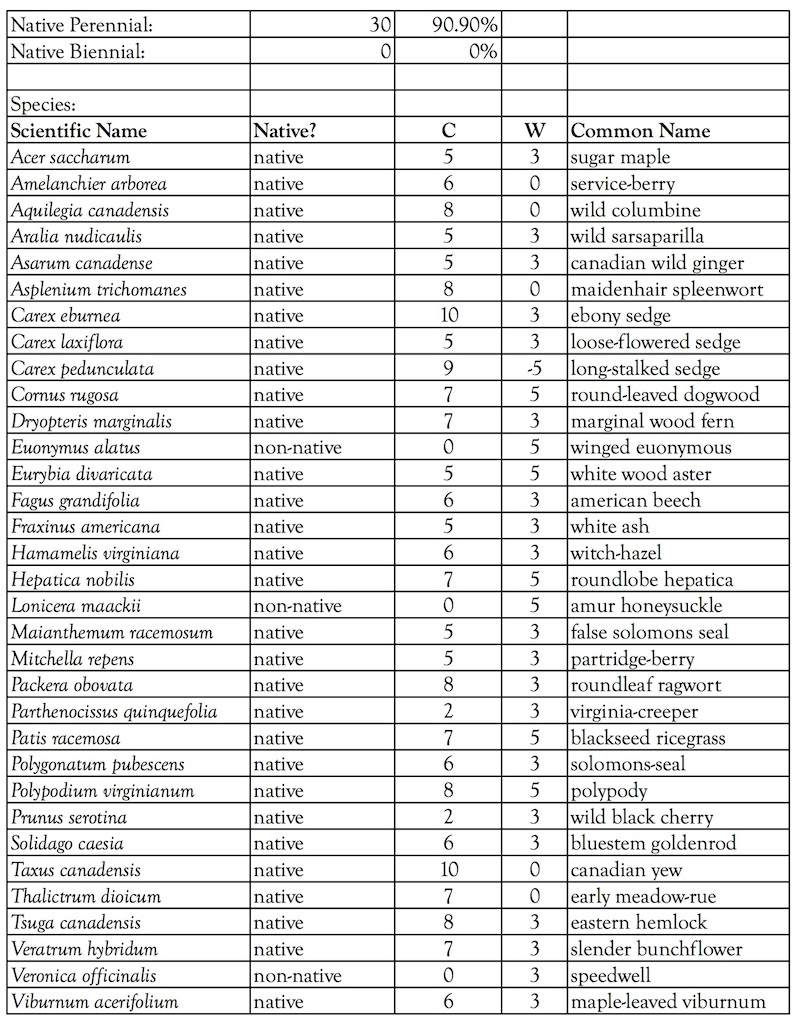
Here's an example of the metrics associated with a 100m2 plot I inventoried on a high quality dolomite cliff I did botanical survey work at in 2017. The Native Mean C is extremely high at 6.4. Even a brief scan of the C values associated with each species shows that most of them are over 5.
Table 2. Sample Plot

Sampling Units
In order to gain statistical strength, inventory work often utilizes replicate sampling units of some type. These are circumscribed areas that can be analyzed as a group to add fidelity to a picture and to answer questions about abundance and diversity.
Typical sampling units include quadrats, which are typically small sample areas (such as 1m2 or smaller). Plots are larger and can provide a truer picture of composition of macrofeatures such as trees. I use 100m2 plots in my survey work. This may sound large, but it's actually a modest circular plot with a radius of about 5.6 meters. I put a temporary stake in the ground in the center of the plot, attach a string of the desired radius, and survey within the circular confines of the area delineated by the string.
Transects are linear survey paths that often have either quadrats or plots placed at designated intervals along the line. For example, one quadrat could be placed every 10 meters.
Locations of sampling units can be randomized in order to limit subjective biases that might influence a practitioner to place plots in specific kinds of places (easy places to access, nice places, etc.) Randomization can be technologically sophisticated, based on Geographic Information System (GIS) map points and random number generators, or can be simpler, such as randomizing intervals between quadrats placed on a transect line using familiar phone numbers or the like.
FQA has no built-in method for weighing species abundance or percent cover, though various modifications have been utilized. My preference at this point is to use replicate quadrats or plots to assess frequency and changes in metrics. For example, if Japanese barberry is found in 8 out of 10 plots before restoration, and white wood aster is found in 2 out of 10, and then after restoration barberry is found in only 1 out of ten, and white wood aster in 6 out of ten, we have solid quantitative information to measure success with. Specific FQA-related changes that can be assessed include shifts in Total Mean C, or in the percentage of plots with conservative species (C value 7-10). Or, the Total FQI of each plot can be averaged and compared with pre-restoration baseline metrics.
A Brief History of FQA in New Jersey
The FQA methodology was originally developed by Gerould Wilhelm and Floyd Swink in the Chicago region. It was a means to positively identify remnant prairie sites in an area (the tallgrass prairie biome) where over 99% of the original prairie had been destroyed. Subsequent work pioneered its applicability for ecological restoration.
Floristic Quality Assessment was originally developed for New Jersey in 2006 through a collaboration of Bowman's Hill Wildflower Preserve (BHWP) and the NJDEP. Tama Matsuoka, Jeannine Vanais, and Leslie Jones Sauer championed the concept for Bowman's Hill, and Kathleen Strakosch Walz (NJDEP) brought expertise, experience, and funding from the EPA.
The New Jersey version of FQA was made publically available as the Plant Stewardship Index (PSI) by Bowman's Hill. BHWP created a web-based application for the PSI so users could enter plant lists, generate metrics, and develop a regional database of plant surveys. Ultimately, the PSI hosted well over a thousand inventories in the database.
I worked part-time as Plant Stewardship Index Coordinator for BHWP from 2012 - 2014. By then the original web application was showing its age and I began to look for alternatives. Gerould Wilhelm, one of the original founders of FQI, told me about UniversalFQA.org, a well-designed common platform now holding C lists for many of the regions in the country. I moved on from my position at BHWP, but continued to work on getting the original PSI lists transferred to UniversalFQA. The heavy lifting was done by Pat Coleman, database programmer and BHWP volunteer, with support from Leslie Jones Sauer, and the transfer was made in 2017.
Meanwhile, Kathleen Strakosch Walz at NJDEP has developed an updated 2017 C value list for New Jersey honed in collaboration with local botanists including Karl Anderson and Linda Kelly. This features updated nomenclature and synonymy, some well-considered adjustments to various C values, and C values for mosses. According to Walz, this list (currently in draft form) should be available on UniversalFQA soon.
With a standardized, accepted tool for assessing ecosystem quality, a goal for the future is to put those assessments into practice to afford protection to the highest quality sites in our region. I'm currently collaborating with a team developing just such a framework.
In addition to land protection and regulation, the FQA is a fundamental tool for restoration practitioners wishing to monitor change over time and communicate successes and failures. Because it can be expressed mathematically and in charts, it can even be used to communicate with engineers and officials who may not have much understanding or interest in plants per se.
If anyone got lost in the transition from the Plant Stewardship Index to UniversalFQA, I'd like to mention that the new online platform is extremely well-designed and easy to use, and that the methodology has gained an even wider acceptance in recent years. For example, it is a fundamental part of the EPA's National Wetlands Condition Assessment. Floristic Quality Assessment is a unique tool for those championing a holistic approach to site quality, plant conservation, and ecological restoration.